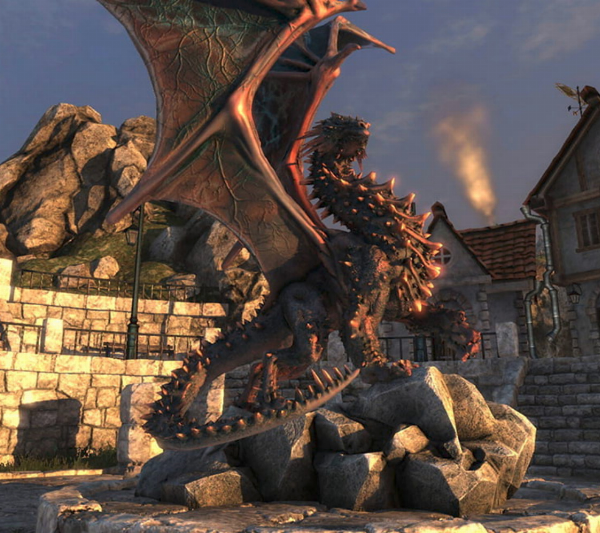
Unigine Heaven

This test calculates the average frame-rate within the Heaven demo for the Unigine engine. This engine is extremely demanding on the system's graphics card.

To run this test with the Phoronix Test Suite, the basic command is: phoronix-test-suite benchmark unigine-heaven.

Project Site

unigine.com

Test Created

6 December 2010

Last Updated

10 August 2024

Test Maintainer

Michael Larabel 

Test Type

Graphics

Average Install Time

4 Seconds

Average Run Time

14 Minutes, 17 Seconds

Accolades

250k+ Downloads + 10k+ Public Benchmark Results

Supported Platforms

Supported Architectures

x86 + x86_64

Public Result Uploads *Reported Test Completions **Reported Installs **Test Profile Page Views ***OpenBenchmarking.orgEventsUnigine Heaven Popularity Statisticspts/unigine-heaven2010.122011.052011.102012.032012.082013.012013.062013.112014.042014.092015.022015.072015.122016.052016.102017.032017.082018.012018.062018.112019.042019.092020.022020.072020.122021.052021.102022.032022.082023.012023.062023.112024.042024.0940K80K120K160K200K
* Uploading of benchmark result data to OpenBenchmarking.org is always optional (opt-in) via the Phoronix Test Suite for users wishing to share their results publicly.
** Data based on those opting to upload their test results to OpenBenchmarking.org and users enabling the opt-in anonymous statistics reporting while running benchmarks from an Internet-connected platform.
*** Test profile page view reporting began March 2021.
Data updated weekly as of 3 January 2025.
1280 x 10247.4%3840 x 21609.3%1024 x 7689.2%2560 x 144014.8%800 x 60010.5%1920 x 108048.9%Resolution Option PopularityOpenBenchmarking.org
Windowed23.8%Fullscreen76.2%Mode Option PopularityOpenBenchmarking.org

Revision History

pts/unigine-heaven-1.6.6   [View Source]   Sat, 10 Aug 2024 09:11:45 GMT
Update download mirrors. Closes: https://github.com/phoronix-test-suite/phoronix-test-suite/issues/800

pts/unigine-heaven-1.6.5   [View Source]   Mon, 09 Nov 2020 15:13:21 GMT
Unigine seems to have updated their binaries thus changed hashes.

pts/unigine-heaven-1.6.4   [View Source]   Tue, 12 Jun 2018 11:58:37 GMT
Add Direct3D 9 and Direct3D 11 renderer options that will appear when running on Windows/Wine.

pts/unigine-heaven-1.6.3   [View Source]   Tue, 27 Feb 2018 16:19:37 GMT
Update Windows download links.

pts/unigine-heaven-1.6.2   [View Source]   Sun, 22 Feb 2015 08:39:17 GMT
Fullscreen switching fix.

pts/unigine-heaven-1.6.1   [View Source]   Thu, 29 Jan 2015 22:36:41 GMT
Add --nox11 to Unigine binary

pts/unigine-heaven-1.6.0   [View Source]   Thu, 22 Jan 2015 17:33:19 GMT
Add windowed mode.

pts/unigine-heaven-1.5.3   [View Source]   Thu, 21 Nov 2013 20:47:52 GMT
First shot at modern Unigine Heaven Microsoft Windows support.

pts/unigine-heaven-1.5.2   [View Source]   Wed, 13 Feb 2013 00:26:53 GMT
Fix directory name.

pts/unigine-heaven-1.5.1   [View Source]   Wed, 13 Feb 2013 00:07:24 GMT
Add the Unigine Heaven 4.0 download link now that it is public.

pts/unigine-heaven-1.5.0   [View Source]   Mon, 11 Feb 2013 23:25:36 GMT
Unigine Heaven 4.0 test profile... This test profile should be all set aside from adding in the correct download URL, file size, and MD5 hash upon the public Unigine Heaven 4.0 release.

pts/unigine-heaven-1.4.0   [View Source]   Wed, 07 Mar 2012 17:57:47 GMT
Update to Unigine Heaven 3.0 release from today upstream.

pts/unigine-heaven-1.3.1   [View Source]   Mon, 29 Aug 2011 12:22:40 GMT
Add Windows Unigine Heaven 2.5 support.

pts/unigine-heaven-1.3.0   [View Source]   Sat, 27 Aug 2011 16:43:12 GMT
Update to Unigine Heaven 2.5 upstream.

pts/unigine-heaven-1.2.0   [View Source]   Mon, 06 Dec 2010 15:26:04 GMT
Initial import into OpenBenchmarking.org

Suites Using This Test

OpenGL Demos Test Suite

Desktop Graphics

Unigine Test Suite


Performance Metrics

Analyze Test Configuration:

Unigine Heaven 4.0

Resolution: 1920 x 1080 - Mode: Fullscreen - Renderer: OpenGL

OpenBenchmarking.org metrics for this test profile configuration based on 4,183 public results since 12 June 2018 with the latest data as of 1 January 2025.

Below is an overview of the generalized performance for components where there is sufficient statistically significant data based upon user-uploaded results. It is important to keep in mind particularly in the Linux/open-source space there can be vastly different OS configurations, with this overview intended to offer just general guidance as to the performance expectations.

Component
Percentile Rank
# Compatible Public Results
Frames Per Second (Average)
100th
23
506 +/- 22
100th
6
497 +/- 14
100th
5
422 +/- 14
98th
28
344 +/- 33
97th
32
326 +/- 43
96th
4
303 +/- 1
95th
35
281 +/- 31
93rd
9
260 +/- 33
93rd
34
259 +/- 14
93rd
4
256 +/- 6
92nd
4
249 +/- 19
91st
16
244 +/- 13
90th
3
226 +/- 11
88th
33
219 +/- 16
88th
23
217 +/- 31
87th
11
209 +/- 18
87th
14
208 +/- 28
85th
3
194 +/- 28
84th
5
187 +/- 19
82nd
10
178 +/- 10
81st
5
177 +/- 20
80th
35
172 +/- 7
77th
7
165 +/- 22
Mid-Tier
75th
< 161
75th
80
161 +/- 13
74th
7
158 +/- 5
74th
4
158 +/- 8
73rd
14
154 +/- 16
73rd
6
153 +/- 17
71st
16
147 +/- 7
70th
13
141 +/- 6
68th
5
137 +/- 1
67th
5
135 +/- 3
65th
3
129 +/- 17
65th
20
128 +/- 10
64th
41
125 +/- 12
64th
4
124 +/- 17
63rd
6
122 +/- 7
55th
4
90 +/- 1
53rd
6
85 +/- 12
Median
50th
82
46th
45
75 +/- 7
45th
34
73 +/- 5
45th
61
73 +/- 6
43rd
6
70 +/- 7
30th
5
38 +/- 5
27th
3
32 +/- 1
Low-Tier
25th
< 27
24th
4
25 +/- 3
21st
7
22 +/- 2
8th
16
8 +/- 1
5th
3
5 +/- 1
Detailed Performance Overview
OpenBenchmarking.orgDistribution Of Public Results - Resolution: 1920 x 1080 - Mode: Fullscreen - Renderer: OpenGL4183 Results Range From 1 To 610 Frames Per Second12651761011261511762012262512763013263513764014264514765015265515766016262004006008001000

Based on OpenBenchmarking.org data, the selected test / test configuration (Unigine Heaven 4.0 - Resolution: 1920 x 1080 - Mode: Fullscreen - Renderer: OpenGL) has an average run-time of 15 minutes. By default this test profile is set to run at least 3 times but may increase if the standard deviation exceeds pre-defined defaults or other calculations deem additional runs necessary for greater statistical accuracy of the result.

OpenBenchmarking.orgMinutesTime Required To Complete BenchmarkResolution: 1920 x 1080 - Mode: Fullscreen - Renderer: OpenGLRun-Time1326395265Min: 5 / Avg: 14.51 / Max: 68

Based on public OpenBenchmarking.org results, the selected test / test configuration has an average standard deviation of 0.3%.

OpenBenchmarking.orgPercent, Fewer Is BetterAverage Deviation Between RunsResolution: 1920 x 1080 - Mode: Fullscreen - Renderer: OpenGLDeviation3691215Min: 0 / Avg: 0.28 / Max: 12

Notable Instruction Set Usage

Notable instruction set extensions supported by this test, based on an automatic analysis by the Phoronix Test Suite / OpenBenchmarking.org analytics engine.

Instruction Set
Support
Instructions Detected
SSE2 (SSE2)
Used by default on supported hardware.
 
CVTSS2SD CVTSI2SD MOVLPD DIVSD MULSD CVTSD2SS CVTTSD2SI ADDSD SUBSD ANDPD COMISD SQRTSD XORPD SUBPD ADDPD UNPCKLPD MULPD SHUFPD UNPCKHPD MAXPD MINPD MAXSD MINSD MOVNTPD CMPNLESD ANDNPD ORPD MOVD CVTDQ2PS CVTPS2DQ PSHUFD MOVNTDQ MOVDQU CVTSD2SI
Last automated analysis: 18 January 2022

This test profile binary relies on the shared libraries libm.so.6, libc.so.6.

Tested CPU Architectures

This benchmark has been successfully tested on the below mentioned architectures. The CPU architectures listed is where successful OpenBenchmarking.org result uploads occurred, namely for helping to determine if a given test is compatible with various alternative CPU architectures.

CPU Architecture
Kernel Identifier
Verified On
Intel / AMD x86 64-bit
x86_64
(Many Processors)
Intel / AMD x86 32-bit
i686
(Many Processors)

Recent Test Results

OpenBenchmarking.org Results Compare

1 System - 16 Benchmark Results

Intel Core i9-9900K - ASUS TUF Z390-PLUS GAMING - Intel Cannon Lake PCH

Ubuntu 24.04 - 6.8.0-51-generic - GNOME Shell 46.0

13 Systems - 11 Benchmark Results

Intel Xeon E5-2680 v4 - INTEL X99-D4 - Intel Xeon E7 v4

Gentoo 2.17 - 6.12.6-gaztuned-xanmod1 - X Server + Wayland

12 Systems - 11 Benchmark Results

Intel Xeon E5-2680 v4 - INTEL X99-D4 - Intel Xeon E7 v4

Gentoo 2.17 - 6.12.6-gaztuned-xanmod1 - X Server + Wayland

1 System - 2 Benchmark Results

AMD Ryzen 9 5900X 12-Core - ASUS ROG STRIX B550-XE GAMING WIFI - AMD Starship

Ubuntu 20.04 - 5.13.0-39-generic - GNOME Shell 3.36.9

1 System - 1 Benchmark Result

AMD Ryzen 7 7700X 8-Core - MSI MAG B650M MORTAR WIFI - 2 x 16384 MB 4800MHz F5-6000J3238F16G

Microsoft Windows 10 Pro Build 19045 - 10.0.19045.4717 - 10.0.19041.3636

1 System - 1 Benchmark Result

AMD Ryzen 7 7700X 8-Core - MSI MAG B650M MORTAR WIFI - 2 x 16384 MB 4800MHz F5-6000J3238F16G

Microsoft Windows 10 Pro Build 19045 - 10.0.19045.4717 - 10.0.19041.3636

1 System - 1 Benchmark Result

AMD Ryzen 7 8845HS - LENOVO LNVNB161216 - AMD Phoenix Root Complex

Arch rolling - 6.12.7-arch1-1 - KDE Plasma 6.2.4

1 System - 8 Benchmark Results

AMD Ryzen 5 5500U - HP 88C6 v74.22 - AMD Renoir

ManjaroLinux 24.2.1 - 6.11.11-1-MANJARO - KDE Plasma 6.2.4

1 System - 1 Benchmark Result

AMD Ryzen 7 7840HS - Framework FRANMZCP07 - AMD Phoenix Root Complex

Fedora Linux 41 - 6.12.5-200.fc41.x86_64 - GNOME Shell 47.2

1 System - 11 Benchmark Results

AMD Ryzen 7 5700X3D 8-Core - Gigabyte B550 AORUS ELITE V2 - 16384 + 16384 + 8192 + 8192 3200MHz

Microsoft Windows 11 Pro Build 22631 - 10.0.22631.4602 - 566.14

1 System - 1 Benchmark Result

Intel Core i7-7700 - ASUS PRIME B250-PRO - Intel Xeon E3-1200 v6

Debian 12 - 6.1.0-28-amd64 - X Server 1.21.1.7

7 Systems - 216 Benchmark Results

AMD Ryzen 5 2600 Six-Core - Gigabyte X470 AORUS ULTRA GAMING-CF - AMD 17h

Ubuntu 23.10 - 6.5.0-44-generic - X Server 1.21.1.7

7 Systems - 216 Benchmark Results

AMD Ryzen 7 5700X 8-Core - Gigabyte X470 AORUS ULTRA GAMING-CF - AMD Starship

Ubuntu 23.10 - 6.5.0-44-generic - X Server 1.21.1.7

7 Systems - 216 Benchmark Results

AMD Ryzen 7 5700X 8-Core - Gigabyte X470 AORUS ULTRA GAMING-CF - AMD Starship

Ubuntu 23.10 - 6.5.0-44-generic - X Server 1.21.1.7

6 Systems - 216 Benchmark Results

AMD Ryzen 5 2600 Six-Core - Gigabyte X470 AORUS ULTRA GAMING-CF - AMD 17h

Ubuntu 23.10 - 6.5.0-44-generic - KDE Plasma 5.27.10

Most Popular Test Results

Find More Test Results