LULESH

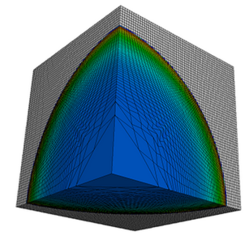
LULESH is the Livermore Unstructured Lagrangian Explicit Shock Hydrodynamics.

To run this test with the Phoronix Test Suite, the basic command is: phoronix-test-suite benchmark lulesh.

Project Site

computing.llnl.gov

Test Created

4 March 2020

Last Updated

11 January 2021

Test Maintainer

Michael Larabel 

Test Type

Processor

Average Install Time

3 Seconds

Average Run Time

2 Minutes, 8 Seconds

Test Dependencies

OpenMPI + C/C++ Compiler Toolchain

Accolades

10k+ Downloads

Supported Platforms


Public Result Uploads *Reported Installs **Reported Test Completions **Test Profile Page Views ***OpenBenchmarking.orgEventsLULESH Popularity Statisticspts/lulesh2017.072017.122018.092020.032020.052020.072020.092020.112021.012021.032021.052021.072021.092021.112022.012022.032022.052022.072022.092022.112023.012023.032023.052023.072023.092023.112024.012024.0314002800420056007000
* Uploading of benchmark result data to OpenBenchmarking.org is always optional (opt-in) via the Phoronix Test Suite for users wishing to share their results publicly.
** Data based on those opting to upload their test results to OpenBenchmarking.org and users enabling the opt-in anonymous statistics reporting while running benchmarks from an Internet-connected platform.
*** Test profile page view reporting began March 2021.
Data updated weekly as of 14 April 2024.

Revision History

pts/lulesh-1.1.1   [View Source]   Mon, 11 Jan 2021 16:17:22 GMT
Flags update.

pts/lulesh-1.1.0   [View Source]   Sun, 10 Jan 2021 16:26:32 GMT
Increase problem size.

pts/lulesh-1.0.1   [View Source]   Wed, 04 Mar 2020 17:08:44 GMT
Missed out on version number.

pts/lulesh-1.0.0   [View Source]   Wed, 04 Mar 2020 17:03:27 GMT
Initial commit of LULESH.

Suites Using This Test

HPC - High Performance Computing

Molecular Dynamics

Scientific Computing


Performance Metrics

Analyze Test Configuration:

LULESH 2.0.3

OpenBenchmarking.org metrics for this test profile configuration based on 1,621 public results since 10 January 2021 with the latest data as of 17 April 2024.

Below is an overview of the generalized performance for components where there is sufficient statistically significant data based upon user-uploaded results. It is important to keep in mind particularly in the Linux/open-source space there can be vastly different OS configurations, with this overview intended to offer just general guidance as to the performance expectations.

Component
Percentile Rank
# Compatible Public Results
z/s (Average)
100th
7
71833 +/- 1650
99th
13
55756 +/- 6234
99th
21
53056 +/- 6004
99th
5
52507 +/- 1052
98th
9
48411 +/- 617
95th
7
43847 +/- 112
94th
34
42271 +/- 919
93rd
12
41828 +/- 605
90th
7
37995 +/- 2903
86th
46
35750 +/- 2597
85th
29
35214 +/- 2495
84th
25
34901 +/- 752
84th
24
34626 +/- 3726
84th
6
33506 +/- 2926
83rd
9
32907 +/- 2533
83rd
5
32785 +/- 2934
82nd
8
31733 +/- 3583
78th
13
28361 +/- 3002
78th
12
28113 +/- 3075
78th
13
28033 +/- 3037
77th
4
27526 +/- 728
77th
6
27136 +/- 215
Mid-Tier
75th
< 25714
75th
7
25192 +/- 920
75th
4
24905 +/- 273
75th
8
24832 +/- 826
75th
12
24749 +/- 1122
75th
10
24359 +/- 1816
74th
9
24080 +/- 2147
73rd
5
23580 +/- 2032
72nd
8
23294 +/- 581
70th
4
22438 +/- 609
70th
9
22342 +/- 234
69th
28
22049 +/- 364
67th
3
20944 +/- 60
67th
10
20728 +/- 147
66th
5
20129 +/- 977
64th
30
19208 +/- 425
62nd
14
18785 +/- 403
61st
3
18718 +/- 9
61st
24
18645 +/- 267
61st
15
18571 +/- 245
60th
23
18540 +/- 1367
60th
12
18510 +/- 1587
60th
18
18426 +/- 1762
58th
4
17646 +/- 338
58th
5
17558 +/- 365
58th
5
17367 +/- 1003
56th
6
16580 +/- 115
56th
6
16470 +/- 43
55th
6
15902 +/- 1253
55th
4
15587 +/- 210
54th
5
14886 +/- 146
54th
5
14653 +/- 111
53rd
3
14229 +/- 49
52nd
3
14148 +/- 529
52nd
5
14035 +/- 44
52nd
5
13972 +/- 75
52nd
5
13928 +/- 222
51st
5
13487 +/- 115
51st
4
13146 +/- 92
51st
5
12874 +/- 75
Median
50th
12595
50th
5
11756 +/- 41
49th
4
10169 +/- 64
49th
4
10081 +/- 260
49th
3
10032 +/- 207
48th
10
9878 +/- 249
48th
8
9864 +/- 230
48th
6
9733 +/- 476
46th
5
9496 +/- 202
46th
7
9481 +/- 465
45th
8
9307 +/- 410
45th
6
9298 +/- 444
44th
3
9008 +/- 163
42nd
19
8600 +/- 495
42nd
14
8551 +/- 884
42nd
15
8483 +/- 523
41st
11
8458 +/- 653
41st
13
8116 +/- 442
41st
5
8044 +/- 43
41st
18
8037 +/- 381
39th
5
7975 +/- 46
37th
3
7604 +/- 57
37th
12
7500 +/- 366
37th
4
7459 +/- 25
36th
3
7326 +/- 83
35th
8
7102 +/- 53
35th
5
6956 +/- 3
35th
5
6887 +/- 34
34th
5
6772 +/- 30
33rd
3
6624 +/- 68
32nd
3
6391 +/- 54
30th
3
5886 +/- 50
30th
21
5701 +/- 318
28th
8
5303 +/- 580
28th
3
5193 +/- 6
26th
3
4966 +/- 2
Low-Tier
25th
< 4821
25th
3
4640 +/- 17
22nd
10
4174 +/- 33
21st
3
3390 +/- 17
20th
5
2732 +/- 14
19th
11
1700 +/- 59
19th
5
1700 +/- 52
19th
5
1653 +/- 11
18th
9
1621 +/- 26
18th
9
1615 +/- 161
17th
4
1575 +/- 7
16th
6
1552 +/- 5
16th
3
1510 +/- 25
16th
7
1497 +/- 50
16th
3
1475 +/- 2
15th
3
1473 +/- 1
15th
3
1412 +/- 3
15th
3
1390 +/- 5
15th
3
1336 +/- 2
14th
4
1295 +/- 3
14th
6
1274 +/- 19
14th
5
1257 +/- 35
14th
3
1255 +/- 6
13th
3
1228 +/- 2
13th
3
1199 +/- 16
13th
4
1197 +/- 8
12th
7
1185 +/- 10
12th
3
1179 +/- 3
11th
4
1169 +/- 3
11th
8
1168 +/- 9
11th
7
1167 +/- 7
10th
5
1154 +/- 3
10th
3
1154 +/- 3
10th
3
1147 +/- 1
10th
3
1146 +/- 4
10th
4
1143 +/- 58
10th
4
1137 +/- 20
10th
3
1136 +/- 6
9th
3
1105 +/- 2
9th
3
1068 +/- 4
8th
3
1026 +/- 1
8th
3
1020 +/- 2
8th
3
991 +/- 4
8th
4
991
8th
6
984 +/- 99
7th
3
950 +/- 4
7th
3
932 +/- 1
7th
4
931 +/- 4
6th
3
869 +/- 1
6th
3
692 +/- 1
5th
4
467 +/- 36
OpenBenchmarking.orgDistribution Of Public Results1617 Results Range From 85 To 74299 z/s85157030554540602575108995104801196513450149351642017905193902087522360238452533026815283002978531270327553424035725372103869540180416654315044635461204760549090505755206053545550305651558000594856097062455639406542566910683956988071365728507433550100150200250

Based on OpenBenchmarking.org data, the selected test / test configuration (LULESH 2.0.3) has an average run-time of 2 minutes. By default this test profile is set to run at least 3 times but may increase if the standard deviation exceeds pre-defined defaults or other calculations deem additional runs necessary for greater statistical accuracy of the result.

OpenBenchmarking.orgMinutesTime Required To Complete BenchmarkRun-Time48121620Min: 1 / Avg: 1.36 / Max: 13

Based on public OpenBenchmarking.org results, the selected test / test configuration has an average standard deviation of 0.2%.

OpenBenchmarking.orgPercent, Fewer Is BetterAverage Deviation Between RunsDeviation246810Min: 0 / Avg: 0.21 / Max: 3

Does It Scale Well With Increasing Cores?

Yes, based on the automated analysis of the collected public benchmark data, this test / test settings does generally scale well with increasing CPU core counts. Data based on publicly available results for this test / test settings, separated by vendor, result divided by the reference CPU clock speed, grouped by matching physical CPU core count, and normalized against the smallest core count tested from each vendor for each CPU having a sufficient number of test samples and statistically significant data.

AMDIntelOpenBenchmarking.orgRelative Core Scaling To BaseLULESH CPU Core Scaling468121624324864961281224364860

Notable Instruction Set Usage

Notable instruction set extensions supported by this test, based on an automatic analysis by the Phoronix Test Suite / OpenBenchmarking.org analytics engine.

Instruction Set
Support
Instructions Detected
SSE2 (SSE2)
Used by default on supported hardware.
 
PUNPCKLQDQ COMISD SUBSD MULSD DIVSD MOVAPD ADDSD MOVHPD MOVDQA MOVUPD SHUFPD UNPCKLPD MOVD MINSD XORPD SUBPD MOVLPD UNPCKHPD MULPD ADDPD ANDPD CMPNLTSD ANDNPD ORPD UCOMISD SQRTSD MAXSD MAXPD CMPLTPD MOVDQU PSHUFD CVTSI2SD CVTTSD2SI
Last automated analysis: 17 January 2022

This test profile binary relies on the shared libraries libmpi.so.40, libm.so.6, libgomp.so.1, libc.so.6, libopen-pal.so.40, libopen-rte.so.40, libhwloc.so.15, libz.so.1, libudev.so.1.

Tested CPU Architectures

This benchmark has been successfully tested on the below mentioned architectures. The CPU architectures listed is where successful OpenBenchmarking.org result uploads occurred, namely for helping to determine if a given test is compatible with various alternative CPU architectures.

CPU Architecture
Kernel Identifier
Verified On
Intel / AMD x86 64-bit
x86_64
(Many Processors)
IBM POWER (PowerPC) 64-bit
ppc64le
POWER9 4-Core
Loongson LoongArch 64-bit
loongarch64
Loongson-3A5000, Loongson-3A5000LL, Loongson-3A6000
Intel / AMD x86 32-bit
i686
(Many Processors)
ARMv8 64-bit
aarch64
ARMv8 Cortex-A72, ARMv8 Cortex-A72 4-Core, ARMv8 Neoverse-N1, ARMv8 Neoverse-N1 128-Core, ARMv8 Neoverse-N1 32-Core, ARMv8 Neoverse-N1 64-Core, ARMv8 Neoverse-V1, ARMv8 Neoverse-V2 72-Core, Ampere ARMv8 Neoverse-N1 128-Core, Ampere ARMv8 Neoverse-N1 160-Core, Ampere ARMv8 Neoverse-N1 256-Core, Ampere Altra ARMv8 Neoverse-N1 160-Core, Ampere Altra ARMv8 Neoverse-N1 80-Core, Ampere eMAG ARMv8 32-Core, Apple M1, Apple M2

Recent Test Results

OpenBenchmarking.org Results Compare

1 System - 1 Benchmark Result

AMD Ryzen 9 7950X3D 16-Core - MSI B650 GAMING PLUS WIFI - AMD Device 14d8

Ubuntu 22.04 - 6.5.0-18-generic - GNOME Shell 42.9

1 System - 1 Benchmark Result

Loongson-3A6000 - Loongson Loongson-3A6000-7A2000-1w-V0.1-EVB Loongson-LS3A6000-7A2000-1w-EVB-V1.21 - Loongson LLC Hyper Transport Bridge

Arch Linux - 6.8.0-4 - X Server 1.21.1.11

1 System - 1 Benchmark Result

Unknown - Loongson Loongson-3A6000-7A2000-1w-V0.1-EVB Loongson-LS3A6000-7A2000-1w-EVB-V1.21 - Loongson LLC Hyper Transport Bridge

Arch Linux - 6.7.0-6 - X Server 1.21.1.9

1 System - 494 Benchmark Results

1 System - 1 Benchmark Result

Intel Core i9-10900K - ASUS ROG MAXIMUS XII EXTREME - Intel Comet Lake PCH

Debian 12 - 6.1.0-17-amd64 - KDE Plasma 5.27.5

1 System - 486 Benchmark Results

Intel Core i3-12100 - MSI MAG B660M MORTAR DDR4 - Intel Alder Lake-S PCH

Arch Linux - 6.1.66-1-lts - GCC 13.2.1 20230801 + Clang 16.0.6

1 System - 486 Benchmark Results

1 System - 566 Benchmark Results

ARMv8 Cortex-A72 - BCM2835 Raspberry Pi 4 Model B Rev 1.5 - Broadcom BCM2711

Arch Linux ARM - 6.1.58-2-rpi-ARCH - GCC 12.1.0 + Clang 16.0.6

1 System - 4 Benchmark Results

Loongson-3A6000 - Loongson Loongson-LS3A6000-7A2000-1w-EVB-V1.21 - Loongson LLC Hyper Transport Bridge

Loongnix 20 - 4.19.0-19-loongson-3 - X Server 1.20.4

1 System - 5 Benchmark Results

Loongson-3A6000 - Loongson Loongson-LS3A6000-7A2000-1w-EVB-V1.21 - Loongson LLC Hyper Transport Bridge

Loongnix 20 - 4.19.0-19-loongson-3 - X Server 1.20.4

1 System - 1 Benchmark Result

Loongson-3A6000 - Loongson Loongson-LS3A6000-7A2000-1w-EVB-V1.21 - Loongson LLC Hyper Transport Bridge

Loongnix 20 - 4.19.0-19-loongson-3 - X Server 1.20.4

1 System - 3 Benchmark Results

Loongson-3A6000 - Loongson Loongson-LS3A6000-7A2000-1w-EVB-V1.21 - Loongson LLC Hyper Transport Bridge

Loongnix 20 - 4.19.0-19-loongson-3 - X Server 1.20.4

1 System - 4 Benchmark Results

Loongson-3A6000 - Loongson Loongson-LS3A6000-7A2000-1w-EVB-V1.21 - Loongson LLC Hyper Transport Bridge

Loongnix 20 - 4.19.0-19-loongson-3 - X Server 1.20.4

1 System - 1 Benchmark Result

AMD Ryzen 7 7800X3D 8-Core - ASUS ROG CROSSHAIR X670E GENE - AMD Device 14d8

Arch rolling - 6.6.1-zen1-1-zen - KDE Plasma 5.27.9

3 Systems - 39 Benchmark Results

AMD Ryzen Threadripper 7980X 64-Cores - ASUS Pro WS TRX50-SAGE WIFI - AMD Device 14a4

Ubuntu 23.10 - 6.5.0-9-generic - GNOME Shell 45.0

Most Popular Test Results

OpenBenchmarking.org Results Compare

8 Systems - 439 Benchmark Results

Intel Core i9-10900K - Gigabyte Z490 AORUS MASTER - Intel Comet Lake PCH

Ubuntu 21.04 - 5.12.0-051200rc3daily20210315-generic - GNOME Shell 3.38.3

5 Systems - 62 Benchmark Results

2 x AMD EPYC 7763 64-Core - AMD DAYTONA_X - AMD Starship

Ubuntu 20.04 - 5.11.0-051100rc6daily20210201-generic - GNOME Shell 3.36.4

8 Systems - 84 Benchmark Results

Intel Xeon E-2288G - Compulab SBC-ATCFL v1.2 - Intel Cannon Lake PCH

Ubuntu 20.10 - 5.8.0-26-generic - GNOME Shell 3.38.1

3 Systems - 376 Benchmark Results

2 x AMD EPYC 7F72 24-Core - Supermicro H11DSi-NT v2.00 - AMD Starship

Ubuntu 20.10 - 5.11.0-rc4-max-boost-inv-patch - GNOME Shell 3.38.1

26 Systems - 438 Benchmark Results

AMD Ryzen Threadripper PRO 3975WX 32-Cores - ASUS Pro WS WRX80E-SAGE SE WIFI - AMD Starship

Fedora 33 - 5.11.7-200.fc33.x86_64 - GNOME Shell 3.38.4

3 Systems - 108 Benchmark Results

Intel Core i7-3770K - ECS Z77H2-A2X v1.0 - Intel Xeon E3-1200 v2

Ubuntu 20.04 - 5.4.0-58-generic - GNOME Shell 3.36.4

4 Systems - 179 Benchmark Results

AMD Ryzen 5 5600X 6-Core - ASRock X570 Taichi - AMD Starship

Ubuntu 20.04 - 5.10.13-051013-lowlatency - GNOME Shell 3.36.4

3 Systems - 191 Benchmark Results

AMD Ryzen 3 2200G - ASUS PRIME B350M-E - AMD Raven

Ubuntu 20.10 - 5.8.0-38-generic - GNOME Shell 3.38.1

5 Systems - 89 Benchmark Results

Intel Core i9-7980XE - ASUS PRIME X299-A - Intel Sky Lake-E DMI3 Registers

Ubuntu 20.10 - 5.8.0-36-generic - GNOME Shell 3.38.1

3 Systems - 32 Benchmark Results

2 x Intel Xeon Gold 5220R - TYAN S7106 - Intel Sky Lake-E DMI3 Registers

Ubuntu 20.04 - 5.9.0-050900rc6-generic - GNOME Shell 3.36.4

5 Systems - 94 Benchmark Results

Intel Xeon Platinum 8375C - Amazon EC2 c6i.4xlarge - Intel 440FX 82441FX PMC

Ubuntu 22.04 - 5.15.0-1004-aws - GCC 11.2.0

3 Systems - 14 Benchmark Results

Intel Core i7-10700T - Logic Supply RXM-181 - Intel Comet Lake PCH

Ubuntu 20.10 - 5.8.0-43-generic - GNOME Shell 3.38.2

4 Systems - 77 Benchmark Results

Intel Core i7-6800K - MSI X99A WORKSTATION - Intel Xeon E7 v4

Ubuntu 20.10 - 5.8.0-33-generic - GNOME Shell 3.38.1

4 Systems - 541 Benchmark Results

AMD Ryzen 7 5800X 8-Core - ASRock X570 Pro4 - AMD Starship

Ubuntu 22.04 - 5.17.4-051704-generic - GNOME Shell 42.0

12 Systems - 453 Benchmark Results

Intel Core i9-11900K - ASUS ROG MAXIMUS XIII HERO - Intel Tiger Lake-H

Ubuntu 21.04 - 5.12.0-051200rc3daily20210315-generic - GNOME Shell 3.38.3

Find More Test Results