GravityMark

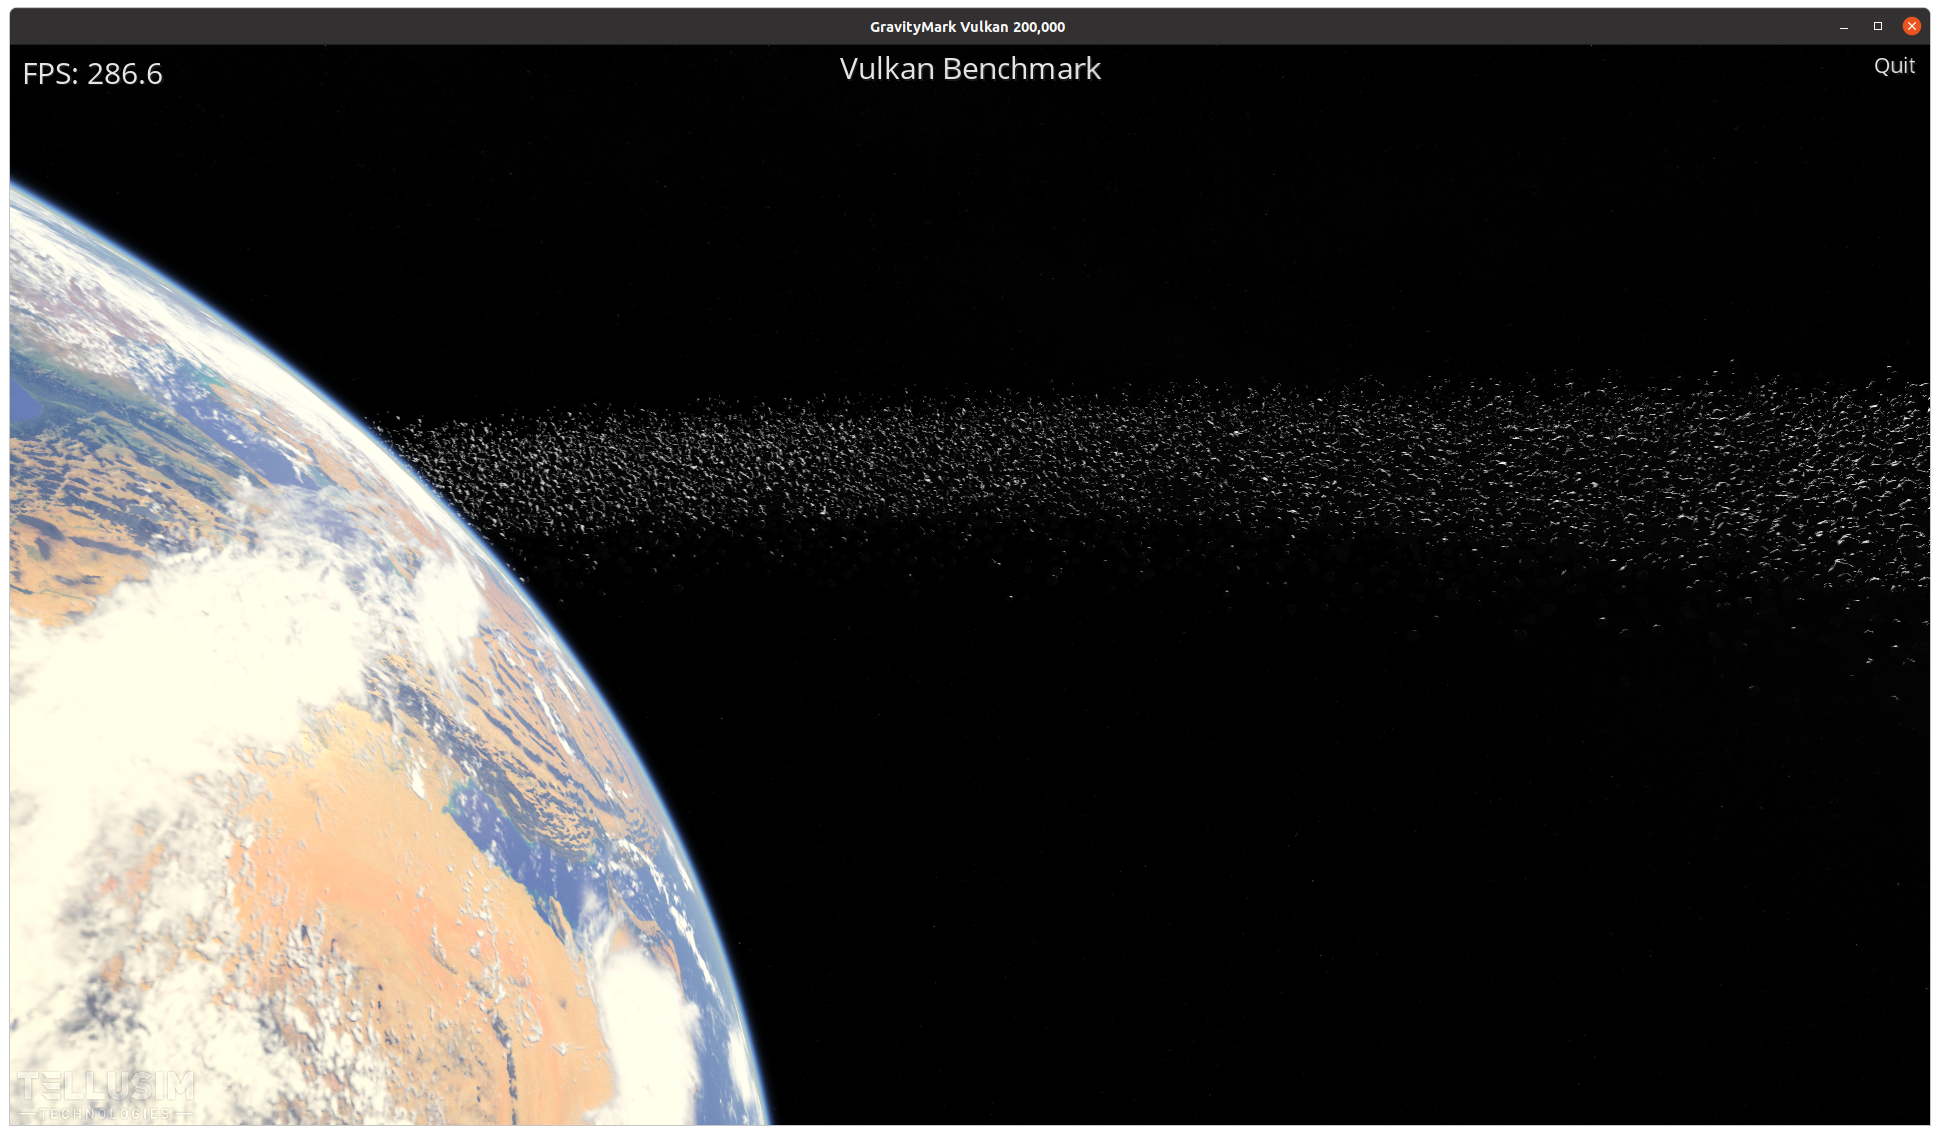
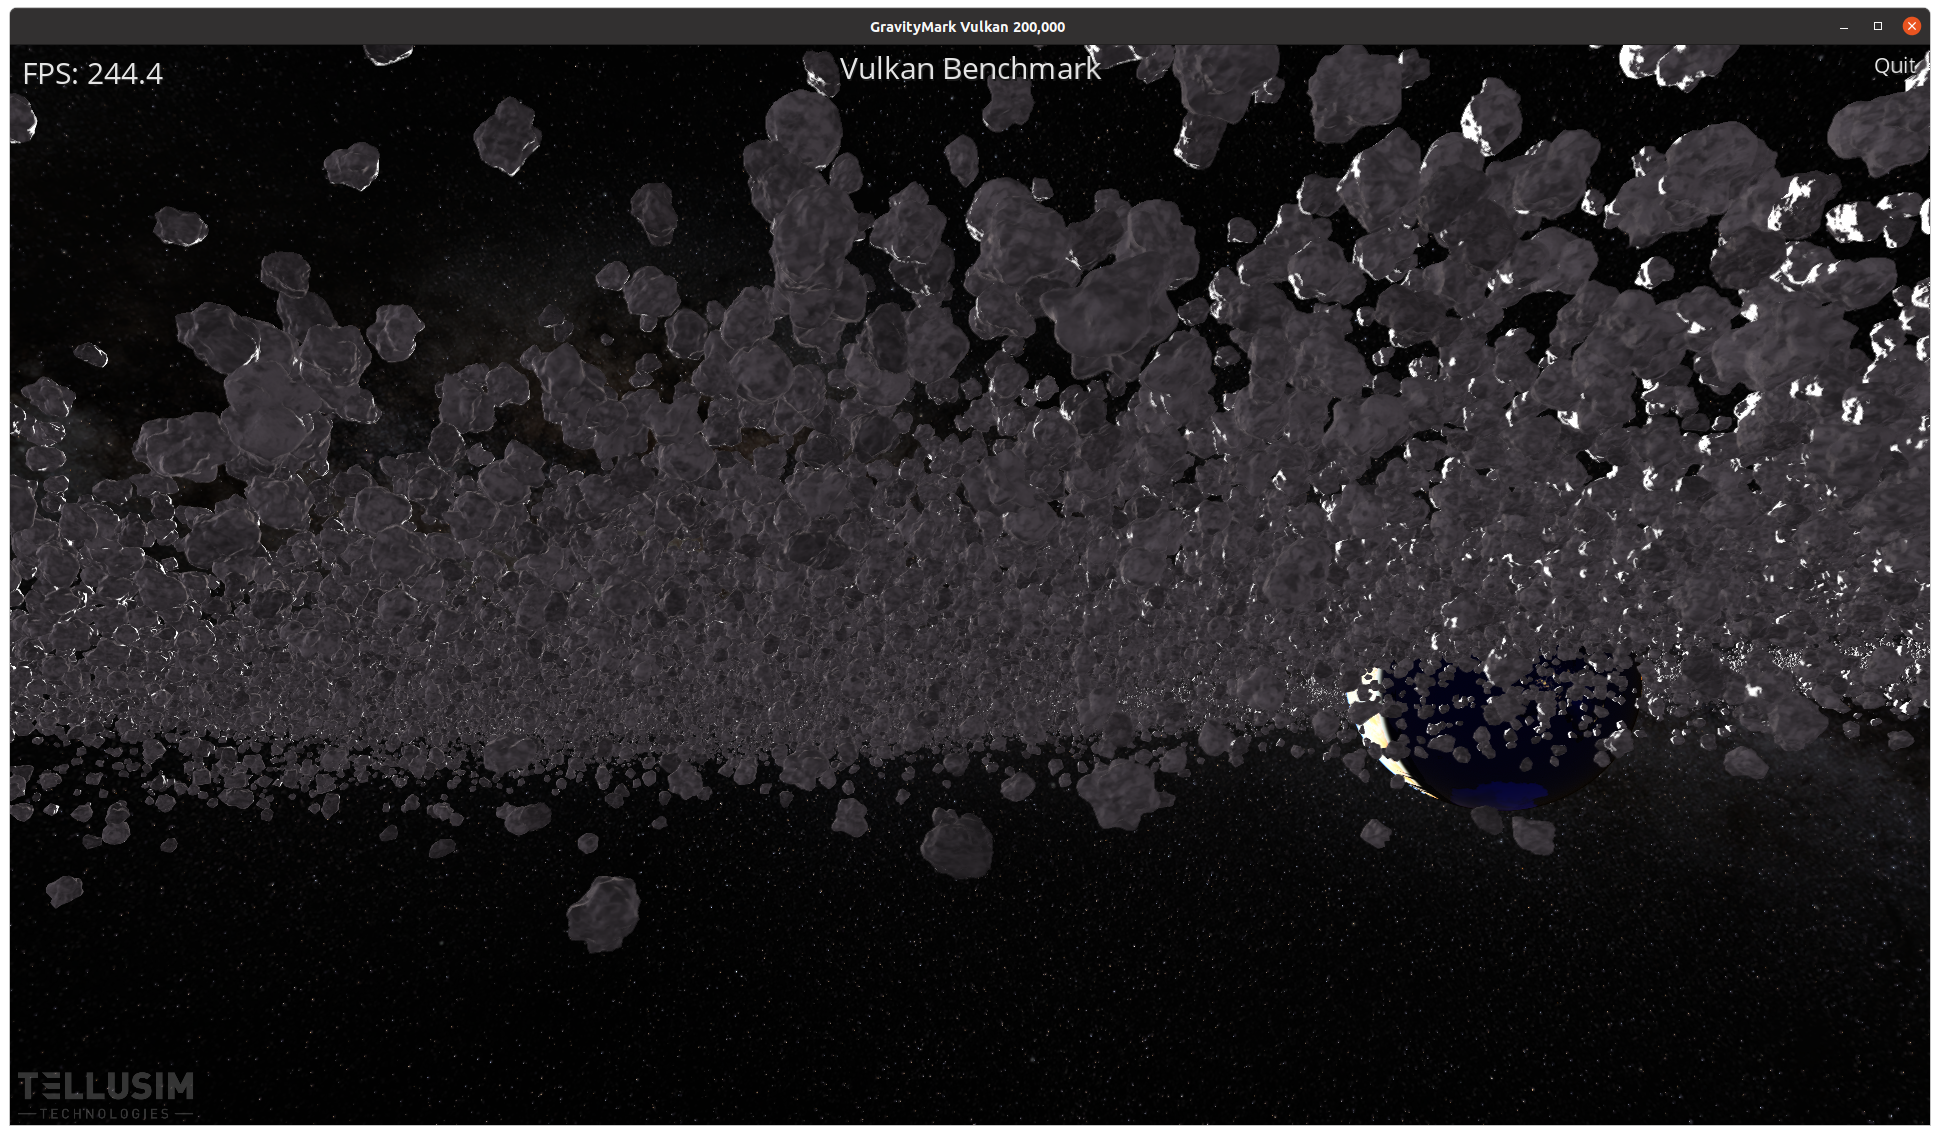
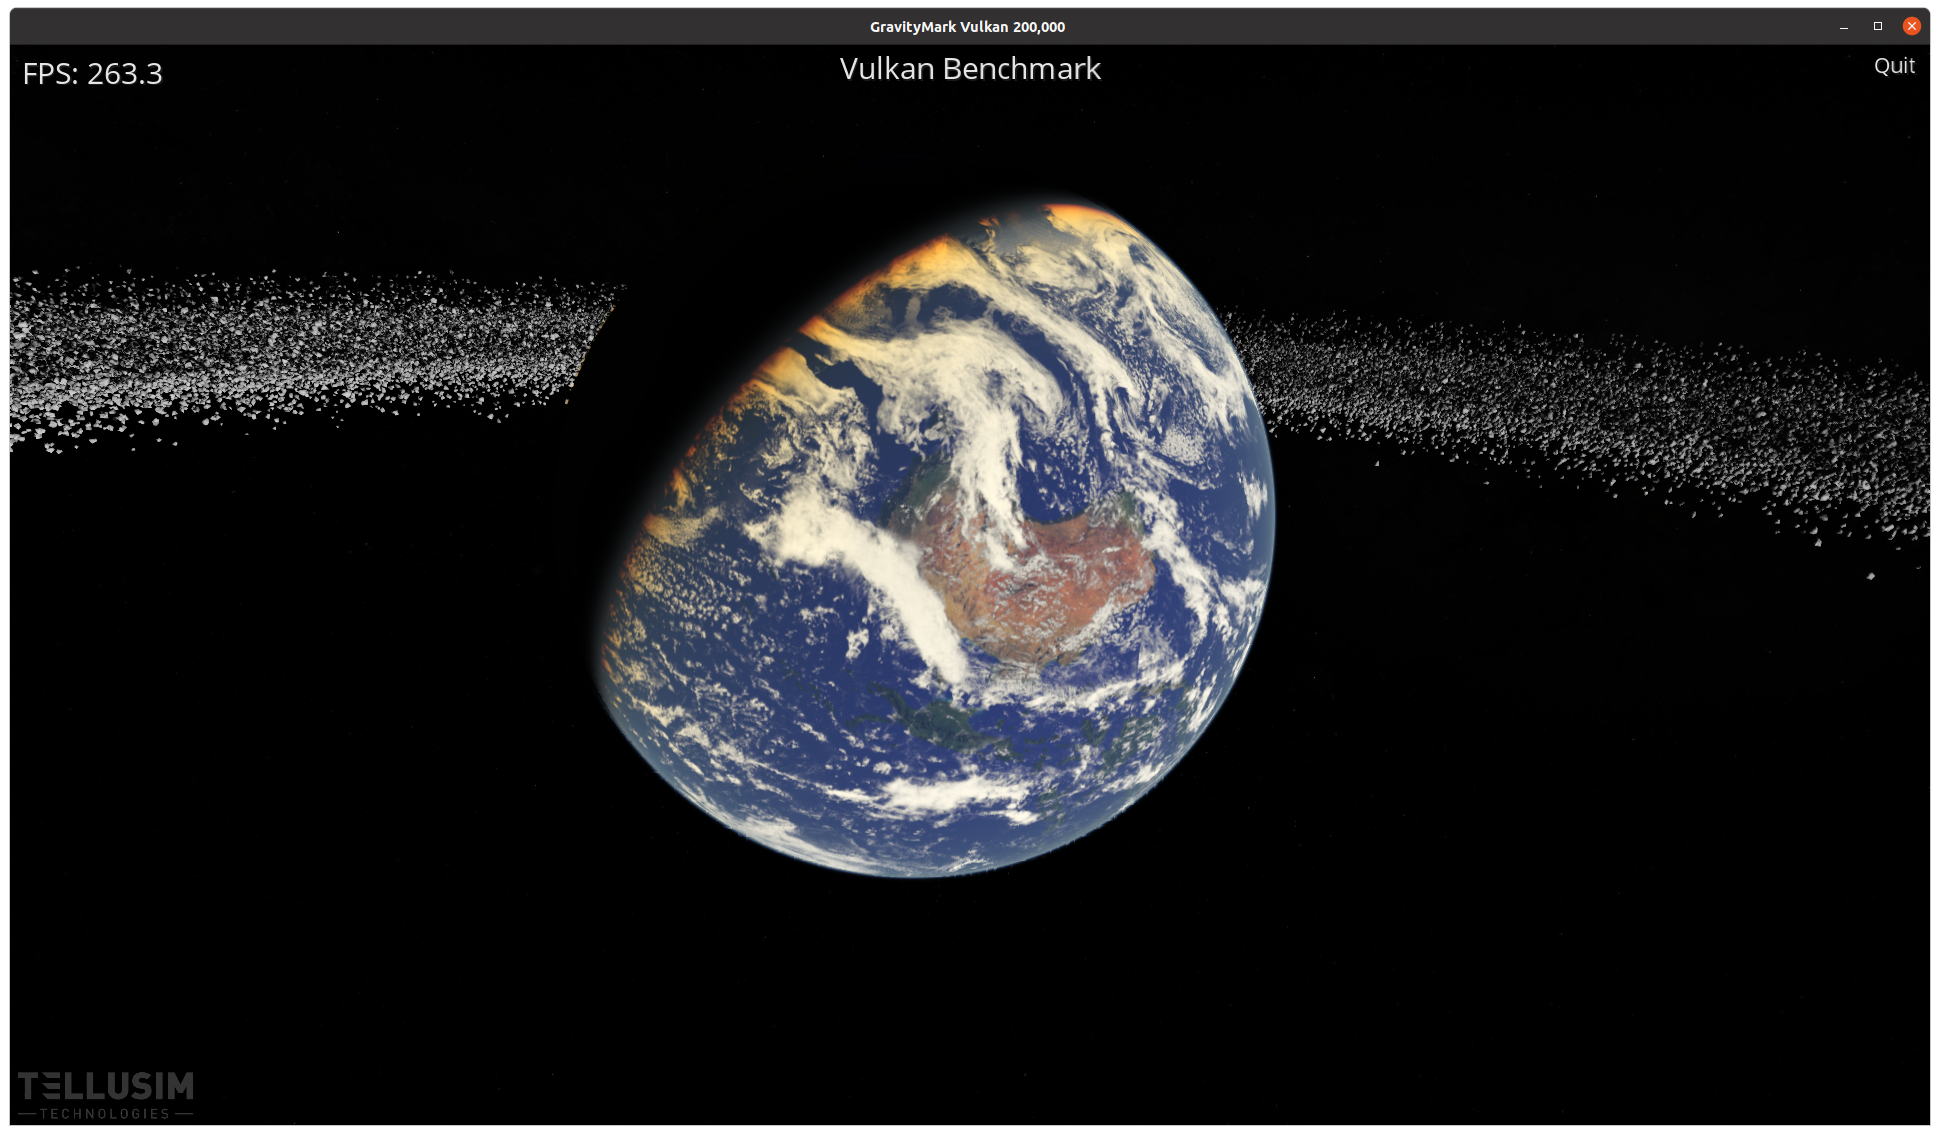
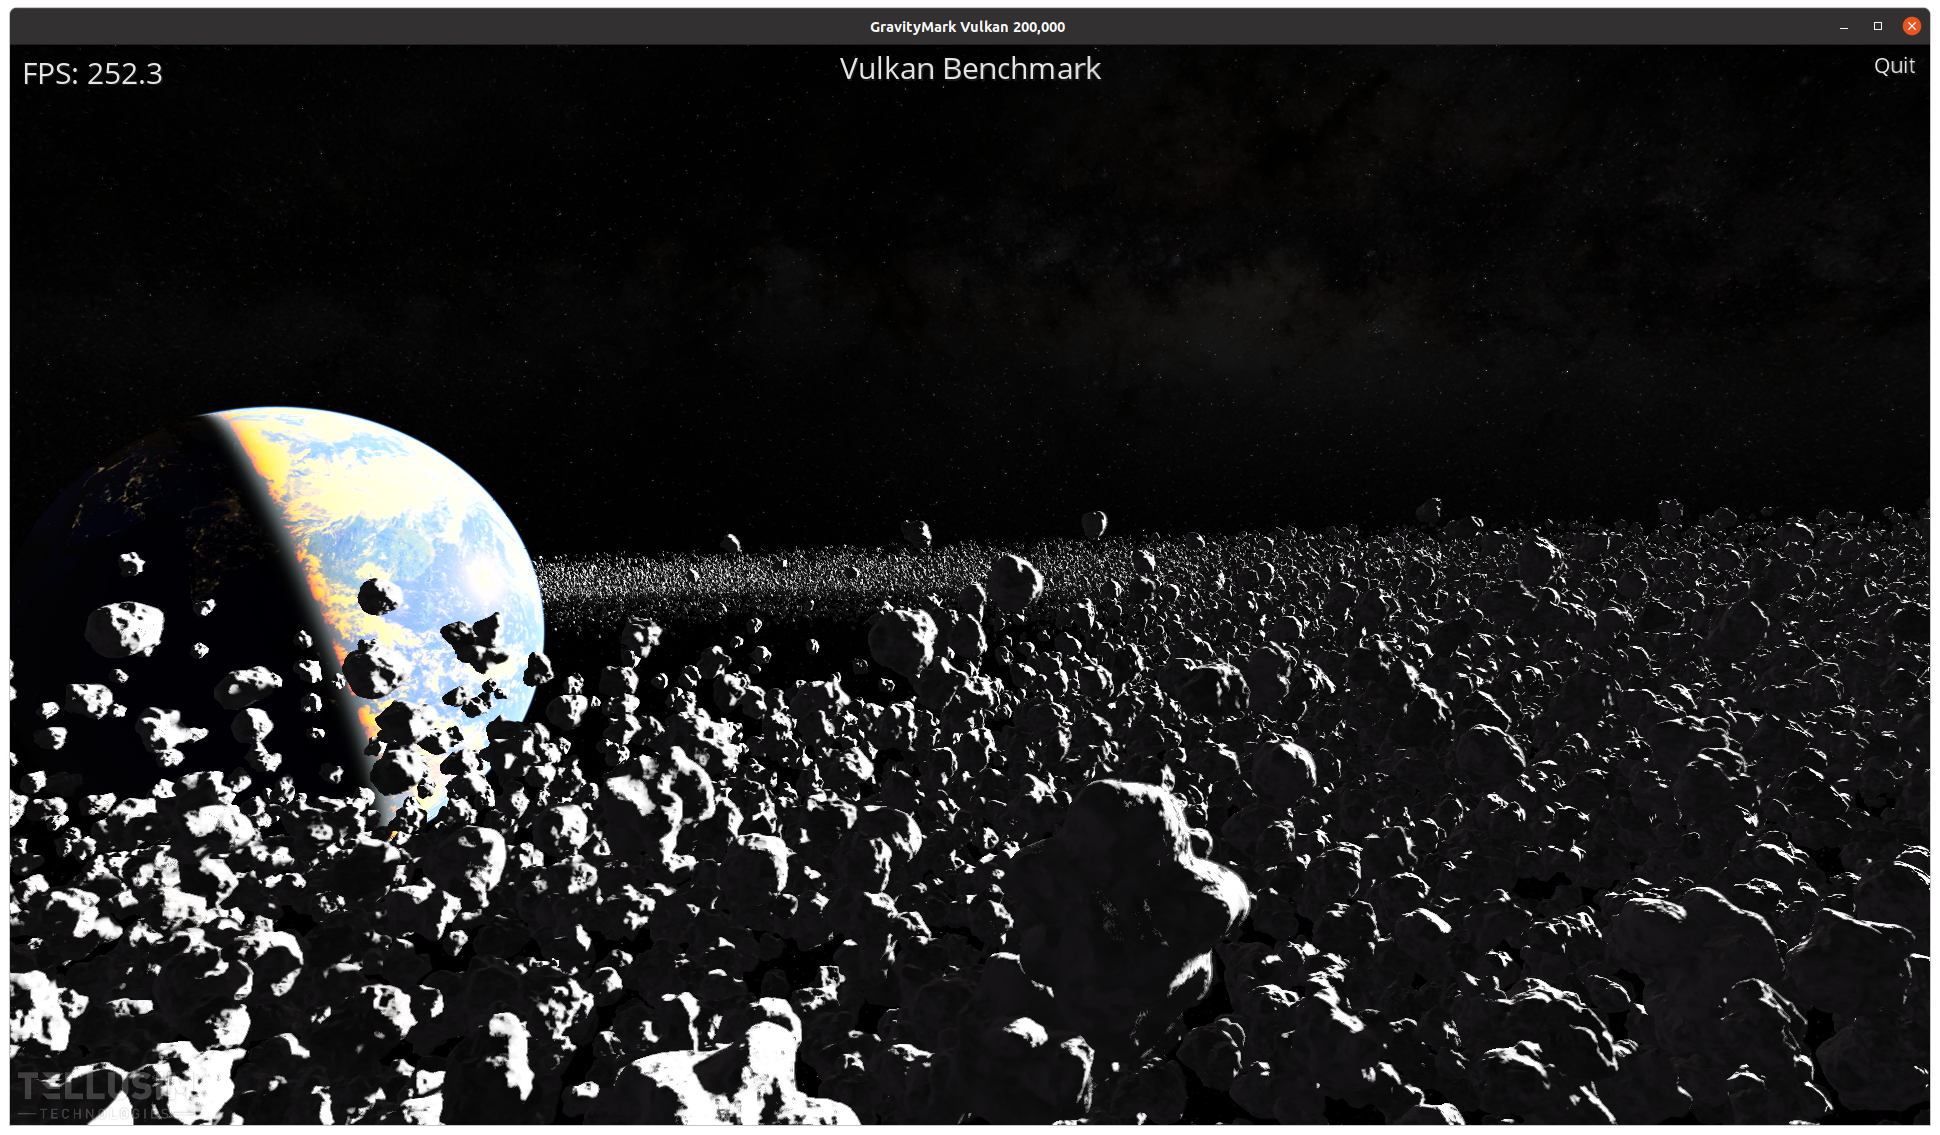
GravityMark is a cross-API, cross-platform GPU accelerated benchmark developed by Tellusim. GravityMark aims to exploit the performance of modern GPUs and render hundreds of thousands of objects in real-time all using GPU acceleration. GravityMark supports a variety of graphics rendering APIs and optionally supports accelerated ray-tracing.
To run this test with the Phoronix Test Suite, the basic command is: phoronix-test-suite benchmark gravitymark.
Project Site
gravitymark.tellusim.comTest Created
15 June 2021Last Updated
4 June 2024Test Maintainer
Michael LarabelTest Type
GraphicsAverage Install Time
7 SecondsAverage Run Time
9 Minutes, 27 SecondsAccolades
50k+ DownloadsSupported Platforms
Supported Architectures


** Data based on those opting to upload their test results to OpenBenchmarking.org and users enabling the opt-in anonymous statistics reporting while running benchmarks from an Internet-connected platform.
Data updated weekly as of 8 July 2024.
Performance Metrics
Analyze Test Configuration:GravityMark 1.87
Resolution: 1920 x 1080 - Renderer: Vulkan
OpenBenchmarking.org metrics for this test profile configuration based on 22 public results since 4 June 2024 with the latest data as of 8 July 2024.
Additional benchmark metrics will come after OpenBenchmarking.org has collected a sufficient data-set.
Based on OpenBenchmarking.org data, the selected test / test configuration (GravityMark 1.87 - Resolution: 1920 x 1080 - Renderer: Vulkan) has an average run-time of 9 minutes. By default this test profile is set to run at least 3 times but may increase if the standard deviation exceeds pre-defined defaults or other calculations deem additional runs necessary for greater statistical accuracy of the result.
Notable Instruction Set Usage
Notable instruction set extensions supported by this test, based on an automatic analysis by the Phoronix Test Suite / OpenBenchmarking.org analytics engine.
Found on Intel processors since at least 2010.
Found on AMD processors since Bulldozer (2011).
This test profile binary relies on the shared libraries libm.so.6, libpthread.so.0, libdl.so.2, libc.so.6.
Tested CPU Architectures
This benchmark has been successfully tested on the below mentioned architectures. The CPU architectures listed is where successful OpenBenchmarking.org result uploads occurred, namely for helping to determine if a given test is compatible with various alternative CPU architectures.
Recent Test Results
 Compare
|
1 System - 4 Benchmark Results |
Intel N100 - American Megatrends LLC. 5.27 - Intel Alder Lake-N PCH Ubuntu 24.04 - 6.8.0-36-generic - GNOME Shell 46.0 |
|
1 System - 1 Benchmark Result |
AMD Ryzen 5 7600X 6-Core - ASRock B650M-HDV/M.2 - AMD Device 14d8 Arch rolling - 6.9.7-arch1-1 - GNOME Shell 46.3.1 |
|
4 Systems - 58 Benchmark Results |
AMD Ryzen 7 7840U - Framework Laptop 13 - AMD Device 14e8 Ubuntu 24.04 - 6.10.0-061000rc4daily20240621-generic - GNOME Shell 46.0 |
|
1 System - 4 Benchmark Results |
Intel Core i9-13900KF - ASUS ROG MAXIMUS Z790 HERO - Intel Device 7a27 Ubuntu 22.04 - 6.5.0-41-generic - GNOME Shell 42.9 |
|
1 System - 1 Benchmark Result |
AMD Ryzen 9 7950X3D 16-Core - MSI MAG X670E TOMAHAWK WIFI - AMD Device 14d8 Ubuntu 22.04 - 6.5.0-41-generic - GNOME Shell 42.9 |
|
1 System - 1 Benchmark Result |
Intel Core i7-9700K - MSI Z390-A PRO - Intel Cannon Lake PCH Ubuntu 24.04 - 6.8.0-36-generic - GNOME Shell 46.0 |
|
2 Systems - 57 Benchmark Results |
AMD Ryzen 7 7840U - Framework Laptop 13 - AMD Device 14e8 Ubuntu 24.04 - 6.10.0-061000rc4daily20240621-generic - GNOME Shell 46.0 |
|
1 System - 1 Benchmark Result |
AMD Ryzen Threadripper 2970WX 24-Core - ASUS ROG ZENITH EXTREME ALPHA - AMD 17h Ubuntu 24.04 - 6.8.0-36-lowlatency - KDE Plasma 5.27.11 |
|
1 System - 57 Benchmark Results |
AMD Ryzen 7 7840U - Framework Laptop 13 - AMD Device 14e8 Ubuntu 24.04 - 6.10.0-061000rc4daily20240621-generic - GNOME Shell 46.0 |
|
1 System - 1 Benchmark Result |
AMD Ryzen 5 5600X 6-Core - Gigabyte B450M DS3H-CF - 4 x 8192MB 2400MHz TEAMGROUP-UD4-3000 Microsoft Windows 11 Professionnel Build 22631 - 10.0.22631.3593 - 555.99 |
|
1 System - 56 Benchmark Results |
AMD Ryzen 7 5800X 8-Core - ASUS ROG STRIX X370-F GAMING - AMD Starship Linuxmint 21.3 - 6.5.0-41-lowlatency - X Server 1.21.1.4 |
|
1 System - 4 Benchmark Results |
AMD Ryzen 5 5600G - MSI B450M MORTAR MAX - AMD Renoir Arch rolling - 6.9.3-arch1-1 - Sway 1.9 |
|
1 System - 1 Benchmark Result |
AMD Ryzen 5 5600G - MSI B450M MORTAR MAX - AMD Renoir Arch rolling - 6.9.3-arch1-1 - Sway 1.9 |
|
4 Systems - 12 Benchmark Results |
Intel Core i9-14900K - ASUS PRIME Z790-P WIFI - Intel Raptor Lake-S PCH Ubuntu 24.04 - 6.8.0-31-generic - GNOME Shell 46.0 |
|
1 System - 1 Benchmark Result |
Intel Core i9-14900K - Gigabyte Z790 AORUS ELITE X WIFI7 - Intel Device 7a27 Ubuntu 22.04 - 6.5.0-35-generic - GNOME Shell 42.9 |