FluidX3D
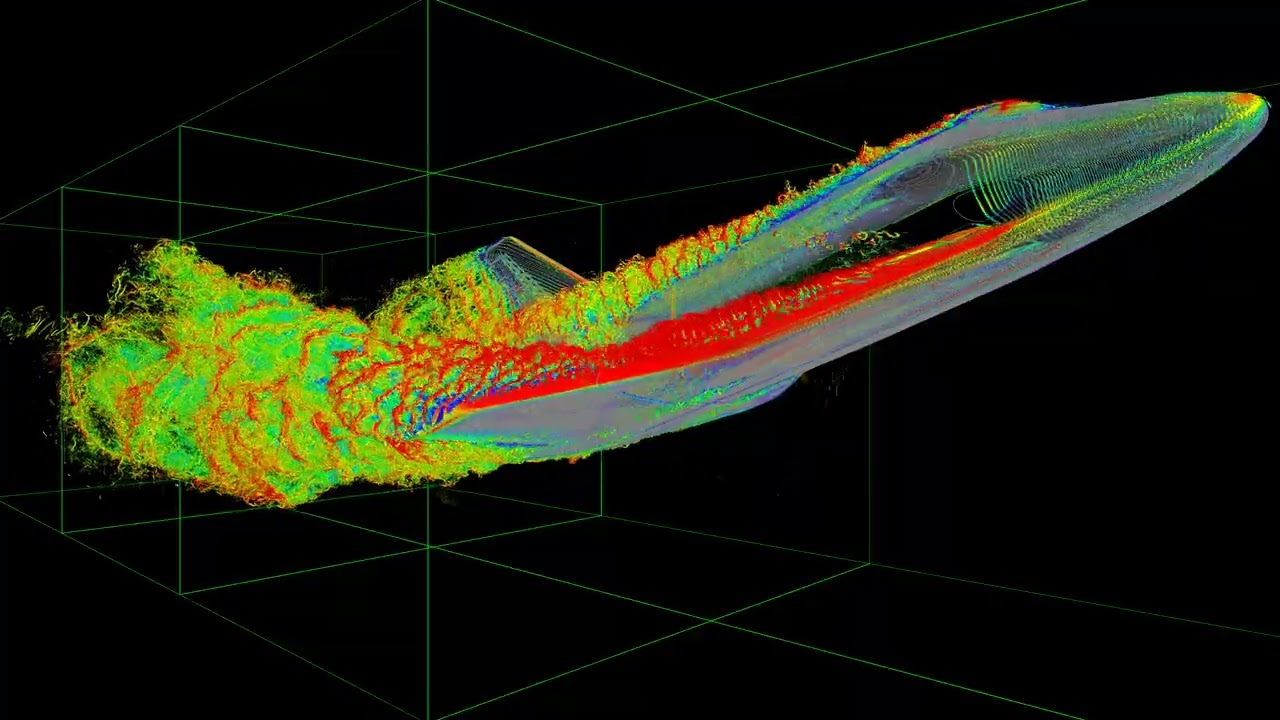
FluidX3D is a speedy and memory efficient Boltzmann CFD (Computational Fluid Dynamics) software package implemented using OpenCL and intended for GPU acceleration. FluidX3D is developed by Moritz Lehmann and written free for non-commercial use. This is a test profile measuring the system OpenCL performance using the FluidX3D benchmark.
To run this test with the Phoronix Test Suite, the basic command is: phoronix-test-suite benchmark fluidx3d.
Project Site
github.comSource Repository
github.comTest Created
17 December 2022Last Updated
22 November 2024Test Maintainer
Michael LarabelTest Type
GraphicsAverage Install Time
3 SecondsAverage Run Time
2 Minutes, 44 SecondsTest Dependencies
OpenCLAccolades
30k+ DownloadsSupported Platforms
Supported Architectures


** Data based on those opting to upload their test results to OpenBenchmarking.org and users enabling the opt-in anonymous statistics reporting while running benchmarks from an Internet-connected platform.
Data updated weekly as of 19 January 2025.
Suites Using This Test
Performance Metrics
Analyze Test Configuration:FluidX3D 3.0
Test: FP32-FP32
OpenBenchmarking.org metrics for this test profile configuration based on 147 public results since 22 November 2024 with the latest data as of 2 January 2025.
Below is an overview of the generalized performance for components where there is sufficient statistically significant data based upon user-uploaded results. It is important to keep in mind particularly in the Linux/open-source space there can be vastly different OS configurations, with this overview intended to offer just general guidance as to the performance expectations.
Based on OpenBenchmarking.org data, the selected test / test configuration (FluidX3D 3.0 - Test: FP32-FP32) has an average run-time of 6 minutes. By default this test profile is set to run at least 3 times but may increase if the standard deviation exceeds pre-defined defaults or other calculations deem additional runs necessary for greater statistical accuracy of the result.
Based on public OpenBenchmarking.org results, the selected test / test configuration has an average standard deviation of 0.1%.
Tested CPU Architectures
This benchmark has been successfully tested on the below mentioned architectures. The CPU architectures listed is where successful OpenBenchmarking.org result uploads occurred, namely for helping to determine if a given test is compatible with various alternative CPU architectures.
Recent Test Results
 Compare
|
1 System - 3 Benchmark Results |
AMD Ryzen 5 5600X 6-Core - ASRock X570 Steel Legend - AMD Starship Arch rolling - 6.12.7-arch1-1 - KDE Plasma 6.2.4 |
|
1 System - 85 Benchmark Results |
AMD Ryzen 9 5900X 12-Core - ASRock X570 Steel Legend - AMD Starship Ubuntu 24.10 - 6.11.0-13-generic - GNOME Shell 47.0 |
|
3 Systems - 69 Benchmark Results |
Intel Core Ultra 9 285K - ASUS ROG MAXIMUS Z890 HERO - Intel Device ae7f Ubuntu 24.10 - 6.13.0-rc1-phx - GNOME Shell 47.0 |
|
1 System - 12 Benchmark Results |
AMD Ryzen 7 3700X 8-Core - Gigabyte X570 I AORUS PRO WIFI - AMD Starship cachyos rolling - 6.12.1-2-cachyos - KDE Plasma 6.2.4 |
|
1 System - 80 Benchmark Results |
Intel Core Ultra 7 256V - ASUS Zenbook S 14 UX5406SA_UX5406SA UX5406SA v1.0 - Intel Device a87f Ubuntu 24.10 - 6.12.0-rc3-phx-aipt - GNOME Shell 47.0 |
|
1 System - 163 Benchmark Results |
Intel Core Ultra 7 256V - ASUS Zenbook S 14 UX5406SA_UX5406SA UX5406SA v1.0 - Intel Device a87f Ubuntu 24.10 - 6.12.0-rc6-phx-drm-next - GNOME Shell 47.0 |
|
1 System - 3 Benchmark Results |
AMD Ryzen Threadripper PRO 3955WX 16-Cores - LENOVO ThinkStation P620 1046 - AMD Starship Linuxmint 22 - 6.8.0-48-generic - Cinnamon 6.2.9 |